http://news.bbc.co.uk/1/hi/in_depth/sci_tech/2004/climate_change/default.stm
Relatively short time period (from 1100 is available above).

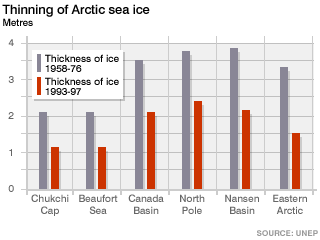
An interesting figure looking at ice thickness.

Of course, all figures should be questioned. The article below gives a broad overview of some of the discussion related to the so called "hockey" stick chart of global warming. As ever, good science is the key.
No comments:
Post a Comment